Lighthouse is an open-source auditing tool created by Google that allows you to determine the quality of webpages for performance, accessibility, PWAs and SEO.
Did you know that you can run a Lighthouse audit straight from the Chrome Dev Tools? Go to any webpage, open the Dev Tools, click on the Lighthouse tab and run an audit.
As web developers, knowing the quality of webpages allows us to determine areas of improvement, especially in areas such as accessibility and performance.
Running manual audits should not be something we get in the habit of doing. As developers, we should automate this task. And, instead of setting up a pipeline (if you don't have one already) for this task specifically, we can utilize Netlify's Lighthouse plugin to get the results with each triggered build.
Let me show you how!
NOTE: Lighthouse would be best used in a preexisting pipeline (GitHub Actions makes this easy), but this tutorial will primarily focus on installing Lighthouse in applications deployed with Netlify.
Setting up Lighthouse with Netlify
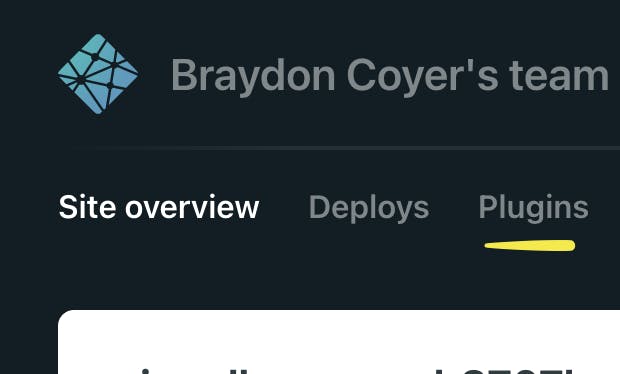
First, head to app.netlify.com and click on your site. Once on your site dashboard, click on the 'Plugins' option in the top navbar.

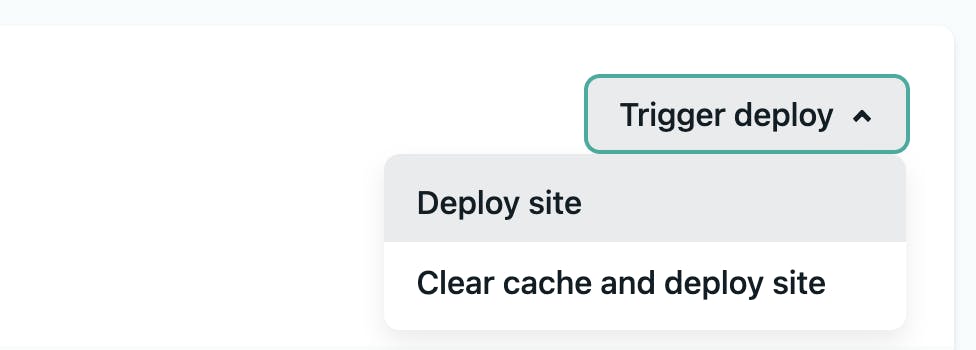
If you don't already have plugins installed, you'll see an empty list. Click on the green 'Go to plugins directory' button and search for the 'Lighthouse' plugin. Install the plugin and head to the 'Deploys' page. Trigger a manual deploy and watch the logs.

After the site is built, near the end of the logs, the results of the audit will be posted in the following format:

Conclusion
There we go! With just a few clicks, we integrated Lighthouse in our Netlify-powered site. Great job!
Thanks for reading! If you liked this article and want more content like this, read some of my other articles , subscribe to my newsletter and make sure to follow me on Twitter!
